CLI Troubleshooting Tools
Zitat von mpachmann am 12. August 2022, 8:57 Uhrhttps://community.sophos.com/sophos-xg-firewall/f/recommended-reads/117389/sophos-xg-cli-troubleshooting-tools#:~:text=conntrack%20This%20command%2Ftool%20is,processed%20in%20the%20Sophos%20XG.
Disclaimer: This information is posted as-is and the content should be referenced at your own risk
This article provides some of the basic troubleshooting tools which can be used from Advanced Shell of XG. To take the Shell access, please SSH into the XG and select option 5. Device Management and 3. Advanced Shell. And for detailed instructions, please refer to this KBA Sophos XG Firewall: How to SSH to the firewall
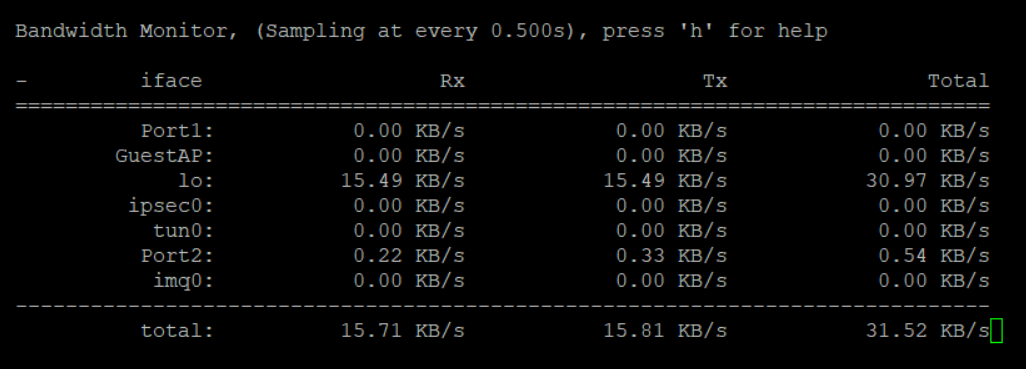
- bwmon This command displays the bandwidth of every interface in XG. By default, it is shown in Kbytes/s. You may press the following buttons on the keyboard to show different values and change the output.
'+' increases sampling time by 100ms
'-' decreases sampling time by 100ms
'u’ cycle: bytes,bits,packets,errors
't' cycle: current rate, max, sum since start, average for last 30s
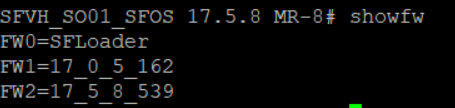
- showfw This command will show the current Firmware version available in SFLoader.
- nslookup This command can be used to resolve a DNS name. By using the "-q" option you can specify which types of DNS records you want to be returned in the results.
For example; nslookup –q=mx sophos.com - would return the MX (Mail Exchanger) records for the Sophos.com domain.
The DNS record types that can be requested are:
A – Host record for an IPv4 address
AAAA – Host record for an IPv6 address
CNAME – An alias for another DNS name
MX – Mail Exchanger
TXT – Used to hold data for things like SPF (Sender Policy Framework), DKIM (DomainKeys Identified Mail) and more
PTR – A pointer to a canonical name
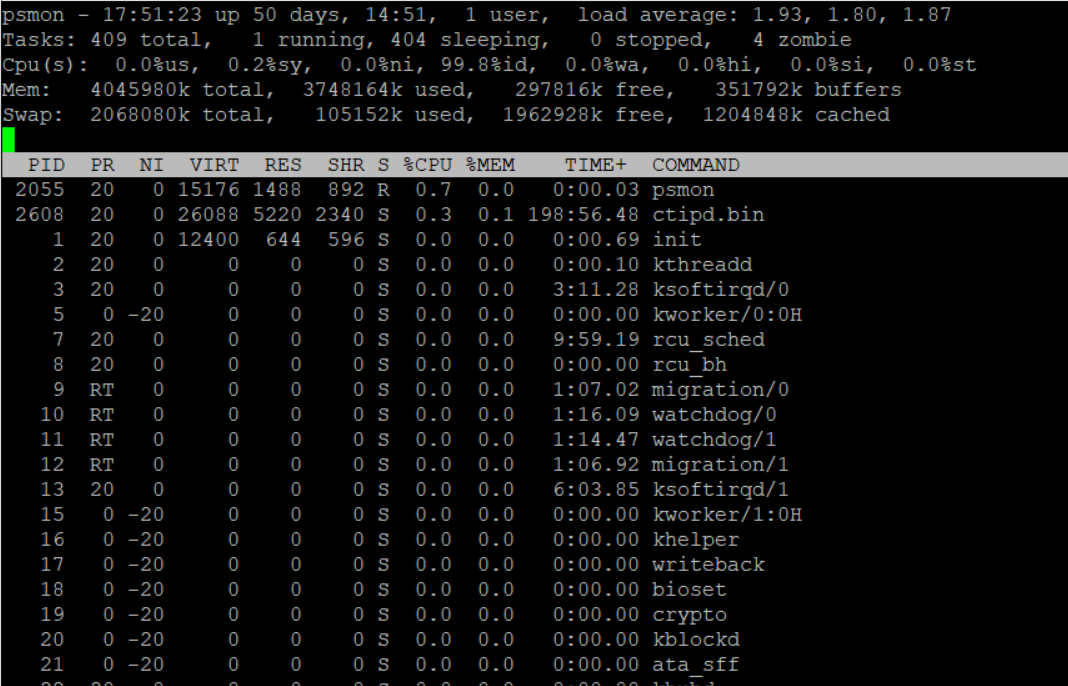
- top/psmon This command provides a dynamic real-time view of a running system. It can display system summary information, as well as a list of processes or threads currently being managed by the kernel. Top/psmon provides an ongoing look at processor activity in real-time. It displays a listing of the most CPU-intensive tasks on the system and can provide an interactive interface for manipulating processes. It can sort the tasks by CPU usage, memory usage, and runtime.
PID - Process Id. The task's unique process ID, which periodically wraps, though never restarting at zero. In kernel terms, it is a dispatchable entity defined by a 'task_struct'.
PR - Priority. The scheduling priority of the task. If you see ‘RT' in this field, it means the task is running under 'real time' scheduling priority.
NI - Nice Value. The nice value of the task. A negative nice value means higher priority, whereas a positive nice value means lower priority. Zero in this field simply means priority will not be adjusted in determining a task's dispatchability.
VIRT - Virtual Memory Size (KiB). The total amount of virtual memory used by the task. It includes all code, data and shared libraries plus pages that have been swapped out and pages that have been mapped but not used.
RES - Resident Memory Size (KiB). The non-swapped physical memory a task has used.
SHR - Shared Memory Size (KiB). The amount of shared memory available to a task, not all of which is typically resident. It simply reflects memory that could be potentially shared with other processes.
S - Process Status. The status of the task which can be one of:
D = uninterruptible sleep
R = running
S = sleeping
T = traced or stopped
Z = zombie
%CPU - CPU Usage. The task's share of the elapsed CPU time since the last screen update, expressed as a percentage of total CPU time.
%MEM - Memory Usage (RES). A task's currently used share of available physical memory.
TIME+ - CPU Time (hundredths). Total CPU time the task has used since it started. The same as 'TIME', but reflecting more granularity through hundredths of a second.
COMMAND - Command name or Command line. Display the command line used to start a task or the name of the associated program. You can toggle between command line and name with "c", which is both a command-line option and an interactive command.
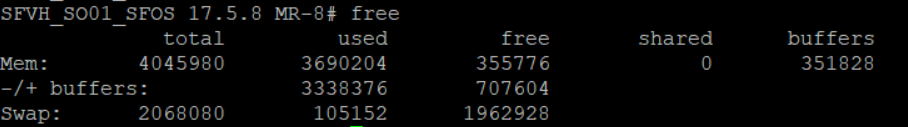
- free This command shows available and used RAM on the device.
- Mem shows how much RAM is currently free or used.
- Buffers indicates how much data is cached into the unused RAM.
- Swap shows you the total available swap and how much is free or used.
- All units on above output are in bytes.
- tcpdump This command is a packet capture tool that allows interception and capture of packets passing through a network interface, making it useful for understanding and troubleshooting network layer problems. It helps in monitoring packet flow coming on the interface, response for each packet, packet drop, and ARP information.
tcpdump [-n] [-i interface] [-w file] [-r file] [-s0] [-X] [-v] [expression]
-n Show IP addresses, rather than hostnames
-i Listen on interface
-w Write to file in pcap format
-r Read from pcap file
-s0 Show the whole packet, do not truncate
-X Show both hex and ascii (helpful for looking at clear text errors)
-v Show verbose output (use -vv and -vvv for more verbose output)
[expression] You can use expressions to filter your query. see below for the most commonly used.
- host [ip | hostname] - filter for a specific host
- port [port number] - filter for a specific port
- icmp - only show ICMP packets (ping and traceroute for example)
- and [not] [or] - you can use multiple expressions together with
- these keywords.
not (‘!=’ or ‘not’) Negation
and (‘&&’ or ‘and’) Concatenation
or (‘||’ or ‘or’) AlternationExamples
To print all packets from host 192.168.1.69 arriving at or departing on eth1 (shows only IP-addresses and verbose output)
tcpdump –eni eth1 host 192.168.1.69To print all ICMP packets arriving at or departing on any interfaces
tcpdump –eni any icmpTo print all packets from host 192.168.0.121 or 192.168.0.135 excluding traffic on port 22 and port 4444 arriving or departing on eth5 (important to exclude packets of the WebAdmin-session and SSH itself)
tcpdump –eni eth5 host 192.168.0.121 or 192.168.0.135 and not port 22 and not port 4444To print all packets to and from port 80 arriving at or departing on eth0
tcpdump –eni eth0 port 80drppkt This command displays the packets dropped by firewall rules. It will provide connection details and details of the packets processed by the device. This will help administrators to troubleshoot errant firewall rules. You can also filter the dropped packets.
drppkt host 10.10.10.1 and port 21 (This will display all dropped packets for host 10.10.10.1 and port 21)
How to view traffic of a ... drppkt command Example specific host drppkt host <ipaddress>drppkt host 10.10.10.1specific source host drppkt src host <ipaddress>drppkt src host 10.10.10.1specific destination host drppkt dst host <ipaddress>drppkt dst host 10.10.10.1specific network drppkt net <network address>drppkt net 10.10.10specific source network drppkt src net <network address>drppkt src net 10.10.10specific destination network drppkt dst net <network address>drppkt dst net 10.10.10specific port drppkt port <port-number>drppkt port 21specific source port drppkt src port <port-number>drppkt src port 21specific destination port drppkt dst port <port-number>drppkt dst port 21specific host for the particular port drppkt host <ipaddress> and port <port-number>drppkt host 10.10.10.1 and port 21the specific host for all the ports except SSH drppkt host <ipaddress> and port not <port-number>drppkt host 10.10.10.1 and port not 22specific protocol drppkt proto ICMP drppkt proto UDP
drppkt proto TCP
drppkt arp
conntrack This command/tool is used to list the connections in Sophos XG. It will also help you identify the firewall rule ID through which this packet was processed in the Sophos XG. In the first example of the captured conntrack, reply-sport is 3128 which was the HTTP proxy port for the XG device from where it was taken. It means that traffic was captured and processed by the Web Proxy of the XG device. Also, take a look at the fwid which indicated the firewall rule which processed the connection.
proto=tcp proto-no=6 timeout=10765 state=ESTABLISHED orig-src=10.160.24.195 orig-dst=172.217.13.195 orig-sport=53498 orig-dport=443 packets=9 bytes=2243 reply-src=10.160.24.1 reply-dst=10.160.24.195 reply-sport=3128 reply-dport=53498 packets=9 bytes=6501 [ASSURED] mark=0x8001 use=2 id=1756024256 masterid=0 fwid=2 policytype=1 user=0 luserid=0 usergp=0 webfltid=1 hotspotid=0 hotspotuserid=0 hb_src=0 hb_dst=0 dnat_done=0 proxy_flags=0 icapid=0 appfltid=1 appid=100 catid=29 appcatid=5 ips=3 ips_nfqueue=0 ips_maxsesbytes=1 inmark=0x0 brdevinindex=0 devinindex=5 devoutindex=0 devin=Port1 devout= inzone=1 outzone=2 bwid=0 upclass=0:0 dnclass=0:0 sslvpnid=0 snatid=1 cluster_node=0 gwoff=0 ctflags=0x4200840a mmflags=0x10802200 dropfix=0 src_mac=00:00:00:00:00:00 dst_mac=00:00:00:00:00:00 vlan_id=0 diffserv=0 current_state[0]=7 current_state[1]=7
In this second example, you can see that fwid is zero but the connection was still processed, which in most cases means that it was a system(XG) generated traffic.
proto=tcp proto-no=6 timeout=10799 state=ESTABLISHED orig-src=10.20.20.63 orig-dst=84.39.152.32 orig-sport=46340 orig-dport=80 packets=7 bytes=1352 reply-src=84.39.152.32 reply-dst=10.20.20.63 reply-sport=80 reply-dport=46340 packets=8 bytes=941 [ASSURED] mark=0x8001 use=1 id=971057744 masterid=0 fwid=0 policytype=0 user=0 luserid=0 usergp=0 webfltid=0 hotspotid=0 hotspotuserid=0 hb_src=0 hb_dst=0 dnat_done=0 proxy_flags=0 icapid=0 appfltid=0 appid=0 catid=0 appcatid=0 ips=0 ips_nfqueue=0 ips_maxsesbytes=0 inmark=0x0 brdevinindex=0 devinindex=0 devoutindex=6 devin= devout=Port2 inzone=0 outzone=0 bwid=0 upclass=0:0 dnclass=0:0 sslvpnid=0 snatid=0 cluster_node=0 gwoff=0 ctflags=0x0 mmflags=0x2000 dropfix=0 src_mac=00:00:00:00:00:00 dst_mac=00:00:00:00:00:00 vlan_id=0 diffserv=0 current_state[0]=8 current_state[1]=8
Conntrack command can be used for multiple purposes but for this specific guide, we will only use this command is syntax conntrack -L which would display or list the connections. Some common parameters and options for conntrack are:
-s, --orig-src ip Source address from original direction
-d, --orig-dst ip Destination address from original direction
-r, --reply-src ip Source addres from reply direction
-q, --reply-dst ip Destination address from reply direction
-p, --protonum proto Layer 4 Protocol, eg. 'tcp'
-P, --not-protonum notproto Except Protonum(Do not use this option with 'p')
-f, --family proto Layer 3 Protocol, eg. 'ipv6'
-t, --timeout timeout Set timeout
-u, --status status Set status, eg. ASSURED
-b, --buffer-size Netlink socket buffer sizei.e. conntrack -L -s 192.168.24.195 -d 8.8.8.8 will display connections for which Src IP is 10.160.24.195 and destination is 8.8.8.8.
proto=icmp proto-no=1 timeout=29 orig-src=10.160.24.195 orig-dst=8.8.8.8 type=8 code=0 id=1 packets=8 bytes=480 reply-src=8.8.8.8 reply-dst=10.20.20.63 type=0 code=0 id=1 packets=8 bytes=480 mark=0x8001 use=2 id=1529445248 masterid=0 fwid=2 policytype=1 user=0 luserid=0 usergp=0 webfltid=1 hotspotid=0 hotspotuserid=0 hb_src=0 hb_dst=0 dnat_done=0 proxy_flags=0 icapid=0 appfltid=1 appid=0 catid=0 appcatid=0 ips=3 ips_nfqueue=100 ips_maxsesbytes=0 inmark=0x0 brdevinindex=0 devinindex=5 devoutindex=6 devin=Port1 devout=Port2 inzone=1 outzone=2 bwid=0 upclass=0:0 dnclass=0:0 sslvpnid=0 snatid=1 cluster_node=0 gwoff=0 ctflags=0x200000a mmflags=0x10902200 dropfix=0 src_mac=00:00:00:00:00:00 dst_mac=00:00:00:00:00:00 vlan_id=0 diffserv=0 current_state[0]=8 current_state[1]=8
The description of different Conntrack fields is mentioned in this table:
fwid Firewall rule id idp IPS policy id webfiltid Web filter policy id appfiltid Application filter policy id snatid Source natting policy id svp sslvpn policy id bwid Bandwidth policy id luserid Live user id user User id usergp Usergroup id hotspotid ID of Hotspot from which traffic is passing hotspotuserid Hotspot User id appid Application id appcatid Application category id catid Web category id inzone zone (lan/wan/dmz) id of in interface outzone zone id of out interface brinindex bridgein device index devinindex in device index devoutindex out device index iif[2] Storing interface index for routing cache ctflags Flags -1 (ctflags) mmflags Flags-2 (mmflags) scanflags Flags-3 (scanflags) proxy_flags Flags-4 (proxy flags) route_dst[2] Caching route in conntrack (both directions) current_state[2] System snapshot number (for state change) classid[2] Bandwidth classes for traffic shaping (QoS) hb_src Heartbeat health for source hb_dst Heartbeat health for destination diffserv DSCP marking (as per firewall rule)

Disclaimer: This information is posted as-is and the content should be referenced at your own risk
This article provides some of the basic troubleshooting tools which can be used from Advanced Shell of XG. To take the Shell access, please SSH into the XG and select option 5. Device Management and 3. Advanced Shell. And for detailed instructions, please refer to this KBA Sophos XG Firewall: How to SSH to the firewall
- bwmon This command displays the bandwidth of every interface in XG. By default, it is shown in Kbytes/s. You may press the following buttons on the keyboard to show different values and change the output.
'+' increases sampling time by 100ms
'-' decreases sampling time by 100ms
'u’ cycle: bytes,bits,packets,errors
't' cycle: current rate, max, sum since start, average for last 30s
- showfw This command will show the current Firmware version available in SFLoader.
- nslookup This command can be used to resolve a DNS name. By using the "-q" option you can specify which types of DNS records you want to be returned in the results.
For example; nslookup –q=mx sophos.com - would return the MX (Mail Exchanger) records for the Sophos.com domain.
The DNS record types that can be requested are:
A – Host record for an IPv4 address
AAAA – Host record for an IPv6 address
CNAME – An alias for another DNS name
MX – Mail Exchanger
TXT – Used to hold data for things like SPF (Sender Policy Framework), DKIM (DomainKeys Identified Mail) and more
PTR – A pointer to a canonical name
- top/psmon This command provides a dynamic real-time view of a running system. It can display system summary information, as well as a list of processes or threads currently being managed by the kernel. Top/psmon provides an ongoing look at processor activity in real-time. It displays a listing of the most CPU-intensive tasks on the system and can provide an interactive interface for manipulating processes. It can sort the tasks by CPU usage, memory usage, and runtime.
PID - Process Id. The task's unique process ID, which periodically wraps, though never restarting at zero. In kernel terms, it is a dispatchable entity defined by a 'task_struct'.
PR - Priority. The scheduling priority of the task. If you see ‘RT' in this field, it means the task is running under 'real time' scheduling priority.
NI - Nice Value. The nice value of the task. A negative nice value means higher priority, whereas a positive nice value means lower priority. Zero in this field simply means priority will not be adjusted in determining a task's dispatchability.
VIRT - Virtual Memory Size (KiB). The total amount of virtual memory used by the task. It includes all code, data and shared libraries plus pages that have been swapped out and pages that have been mapped but not used.
RES - Resident Memory Size (KiB). The non-swapped physical memory a task has used.
SHR - Shared Memory Size (KiB). The amount of shared memory available to a task, not all of which is typically resident. It simply reflects memory that could be potentially shared with other processes.
S - Process Status. The status of the task which can be one of:
D = uninterruptible sleep
R = running
S = sleeping
T = traced or stopped
Z = zombie
%CPU - CPU Usage. The task's share of the elapsed CPU time since the last screen update, expressed as a percentage of total CPU time.
%MEM - Memory Usage (RES). A task's currently used share of available physical memory.
TIME+ - CPU Time (hundredths). Total CPU time the task has used since it started. The same as 'TIME', but reflecting more granularity through hundredths of a second.
COMMAND - Command name or Command line. Display the command line used to start a task or the name of the associated program. You can toggle between command line and name with "c", which is both a command-line option and an interactive command.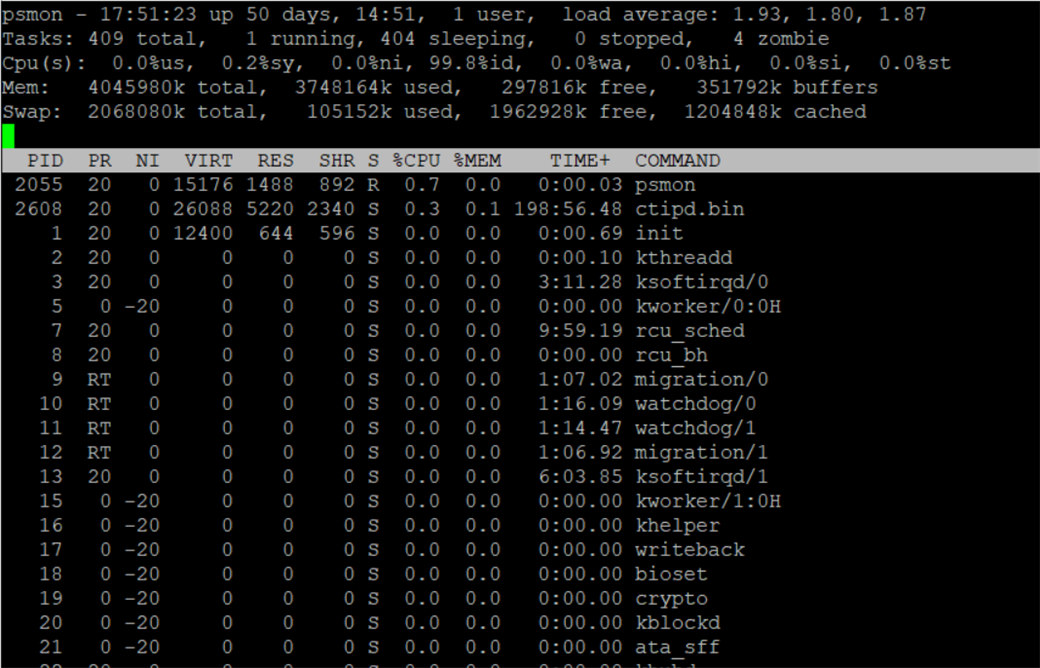
- free This command shows available and used RAM on the device.
- Mem shows how much RAM is currently free or used.
- Buffers indicates how much data is cached into the unused RAM.
- Swap shows you the total available swap and how much is free or used.
- All units on above output are in bytes.

- tcpdump This command is a packet capture tool that allows interception and capture of packets passing through a network interface, making it useful for understanding and troubleshooting network layer problems. It helps in monitoring packet flow coming on the interface, response for each packet, packet drop, and ARP information.
tcpdump [-n] [-i interface] [-w file] [-r file] [-s0] [-X] [-v] [expression]
-n Show IP addresses, rather than hostnames
-i Listen on interface
-w Write to file in pcap format
-r Read from pcap file
-s0 Show the whole packet, do not truncate
-X Show both hex and ascii (helpful for looking at clear text errors)
-v Show verbose output (use -vv and -vvv for more verbose output)
[expression] You can use expressions to filter your query. see below for the most commonly used.- host [ip | hostname] - filter for a specific host
- port [port number] - filter for a specific port
- icmp - only show ICMP packets (ping and traceroute for example)
- and [not] [or] - you can use multiple expressions together with
- these keywords.
not (‘!=’ or ‘not’) Negation
and (‘&&’ or ‘and’) Concatenation
or (‘||’ or ‘or’) AlternationExamples
To print all packets from host 192.168.1.69 arriving at or departing on eth1 (shows only IP-addresses and verbose output)
tcpdump –eni eth1 host 192.168.1.69To print all ICMP packets arriving at or departing on any interfaces
tcpdump –eni any icmpTo print all packets from host 192.168.0.121 or 192.168.0.135 excluding traffic on port 22 and port 4444 arriving or departing on eth5 (important to exclude packets of the WebAdmin-session and SSH itself)
tcpdump –eni eth5 host 192.168.0.121 or 192.168.0.135 and not port 22 and not port 4444To print all packets to and from port 80 arriving at or departing on eth0
tcpdump –eni eth0 port 80 -
drppkt This command displays the packets dropped by firewall rules. It will provide connection details and details of the packets processed by the device. This will help administrators to troubleshoot errant firewall rules. You can also filter the dropped packets.
drppkt host 10.10.10.1 and port 21 (This will display all dropped packets for host 10.10.10.1 and port 21)
How to view traffic of a ... drppkt command Example specific host drppkt host <ipaddress>drppkt host 10.10.10.1specific source host drppkt src host <ipaddress>drppkt src host 10.10.10.1specific destination host drppkt dst host <ipaddress>drppkt dst host 10.10.10.1specific network drppkt net <network address>drppkt net 10.10.10specific source network drppkt src net <network address>drppkt src net 10.10.10specific destination network drppkt dst net <network address>drppkt dst net 10.10.10specific port drppkt port <port-number>drppkt port 21specific source port drppkt src port <port-number>drppkt src port 21specific destination port drppkt dst port <port-number>drppkt dst port 21specific host for the particular port drppkt host <ipaddress> and port <port-number>drppkt host 10.10.10.1 and port 21the specific host for all the ports except SSH drppkt host <ipaddress> and port not <port-number>drppkt host 10.10.10.1 and port not 22specific protocol drppkt proto ICMP drppkt proto UDP
drppkt proto TCP
drppkt arp
-
conntrack This command/tool is used to list the connections in Sophos XG. It will also help you identify the firewall rule ID through which this packet was processed in the Sophos XG. In the first example of the captured conntrack, reply-sport is 3128 which was the HTTP proxy port for the XG device from where it was taken. It means that traffic was captured and processed by the Web Proxy of the XG device. Also, take a look at the fwid which indicated the firewall rule which processed the connection.
proto=tcp proto-no=6 timeout=10765 state=ESTABLISHED orig-src=10.160.24.195 orig-dst=172.217.13.195 orig-sport=53498 orig-dport=443 packets=9 bytes=2243 reply-src=10.160.24.1 reply-dst=10.160.24.195 reply-sport=3128 reply-dport=53498 packets=9 bytes=6501 [ASSURED] mark=0x8001 use=2 id=1756024256 masterid=0 fwid=2 policytype=1 user=0 luserid=0 usergp=0 webfltid=1 hotspotid=0 hotspotuserid=0 hb_src=0 hb_dst=0 dnat_done=0 proxy_flags=0 icapid=0 appfltid=1 appid=100 catid=29 appcatid=5 ips=3 ips_nfqueue=0 ips_maxsesbytes=1 inmark=0x0 brdevinindex=0 devinindex=5 devoutindex=0 devin=Port1 devout= inzone=1 outzone=2 bwid=0 upclass=0:0 dnclass=0:0 sslvpnid=0 snatid=1 cluster_node=0 gwoff=0 ctflags=0x4200840a mmflags=0x10802200 dropfix=0 src_mac=00:00:00:00:00:00 dst_mac=00:00:00:00:00:00 vlan_id=0 diffserv=0 current_state[0]=7 current_state[1]=7
In this second example, you can see that fwid is zero but the connection was still processed, which in most cases means that it was a system(XG) generated traffic.
proto=tcp proto-no=6 timeout=10799 state=ESTABLISHED orig-src=10.20.20.63 orig-dst=84.39.152.32 orig-sport=46340 orig-dport=80 packets=7 bytes=1352 reply-src=84.39.152.32 reply-dst=10.20.20.63 reply-sport=80 reply-dport=46340 packets=8 bytes=941 [ASSURED] mark=0x8001 use=1 id=971057744 masterid=0 fwid=0 policytype=0 user=0 luserid=0 usergp=0 webfltid=0 hotspotid=0 hotspotuserid=0 hb_src=0 hb_dst=0 dnat_done=0 proxy_flags=0 icapid=0 appfltid=0 appid=0 catid=0 appcatid=0 ips=0 ips_nfqueue=0 ips_maxsesbytes=0 inmark=0x0 brdevinindex=0 devinindex=0 devoutindex=6 devin= devout=Port2 inzone=0 outzone=0 bwid=0 upclass=0:0 dnclass=0:0 sslvpnid=0 snatid=0 cluster_node=0 gwoff=0 ctflags=0x0 mmflags=0x2000 dropfix=0 src_mac=00:00:00:00:00:00 dst_mac=00:00:00:00:00:00 vlan_id=0 diffserv=0 current_state[0]=8 current_state[1]=8
Conntrack command can be used for multiple purposes but for this specific guide, we will only use this command is syntax conntrack -L which would display or list the connections. Some common parameters and options for conntrack are:
-s, --orig-src ip Source address from original direction
-d, --orig-dst ip Destination address from original direction
-r, --reply-src ip Source addres from reply direction
-q, --reply-dst ip Destination address from reply direction
-p, --protonum proto Layer 4 Protocol, eg. 'tcp'
-P, --not-protonum notproto Except Protonum(Do not use this option with 'p')
-f, --family proto Layer 3 Protocol, eg. 'ipv6'
-t, --timeout timeout Set timeout
-u, --status status Set status, eg. ASSURED
-b, --buffer-size Netlink socket buffer sizei.e. conntrack -L -s 192.168.24.195 -d 8.8.8.8 will display connections for which Src IP is 10.160.24.195 and destination is 8.8.8.8.
proto=icmp proto-no=1 timeout=29 orig-src=10.160.24.195 orig-dst=8.8.8.8 type=8 code=0 id=1 packets=8 bytes=480 reply-src=8.8.8.8 reply-dst=10.20.20.63 type=0 code=0 id=1 packets=8 bytes=480 mark=0x8001 use=2 id=1529445248 masterid=0 fwid=2 policytype=1 user=0 luserid=0 usergp=0 webfltid=1 hotspotid=0 hotspotuserid=0 hb_src=0 hb_dst=0 dnat_done=0 proxy_flags=0 icapid=0 appfltid=1 appid=0 catid=0 appcatid=0 ips=3 ips_nfqueue=100 ips_maxsesbytes=0 inmark=0x0 brdevinindex=0 devinindex=5 devoutindex=6 devin=Port1 devout=Port2 inzone=1 outzone=2 bwid=0 upclass=0:0 dnclass=0:0 sslvpnid=0 snatid=1 cluster_node=0 gwoff=0 ctflags=0x200000a mmflags=0x10902200 dropfix=0 src_mac=00:00:00:00:00:00 dst_mac=00:00:00:00:00:00 vlan_id=0 diffserv=0 current_state[0]=8 current_state[1]=8
The description of different Conntrack fields is mentioned in this table:
fwid Firewall rule id idp IPS policy id webfiltid Web filter policy id appfiltid Application filter policy id snatid Source natting policy id svp sslvpn policy id bwid Bandwidth policy id luserid Live user id user User id usergp Usergroup id hotspotid ID of Hotspot from which traffic is passing hotspotuserid Hotspot User id appid Application id appcatid Application category id catid Web category id inzone zone (lan/wan/dmz) id of in interface outzone zone id of out interface brinindex bridgein device index devinindex in device index devoutindex out device index iif[2] Storing interface index for routing cache ctflags Flags -1 (ctflags) mmflags Flags-2 (mmflags) scanflags Flags-3 (scanflags) proxy_flags Flags-4 (proxy flags) route_dst[2] Caching route in conntrack (both directions) current_state[2] System snapshot number (for state change) classid[2] Bandwidth classes for traffic shaping (QoS) hb_src Heartbeat health for source hb_dst Heartbeat health for destination diffserv DSCP marking (as per firewall rule)